Amar was excited. His loan default predictor from Lessons 7–8 had 87% accuracy. He showed it to a microfinance NGO in Vizag that lends to self-help groups in fishing villages. They wanted to use it. But then one of their officers asked: "Did you check if it treats applicants from coastal communities the same as urban applicants? Our training data has very few loans from Araku Valley — it might just deny everyone from there."
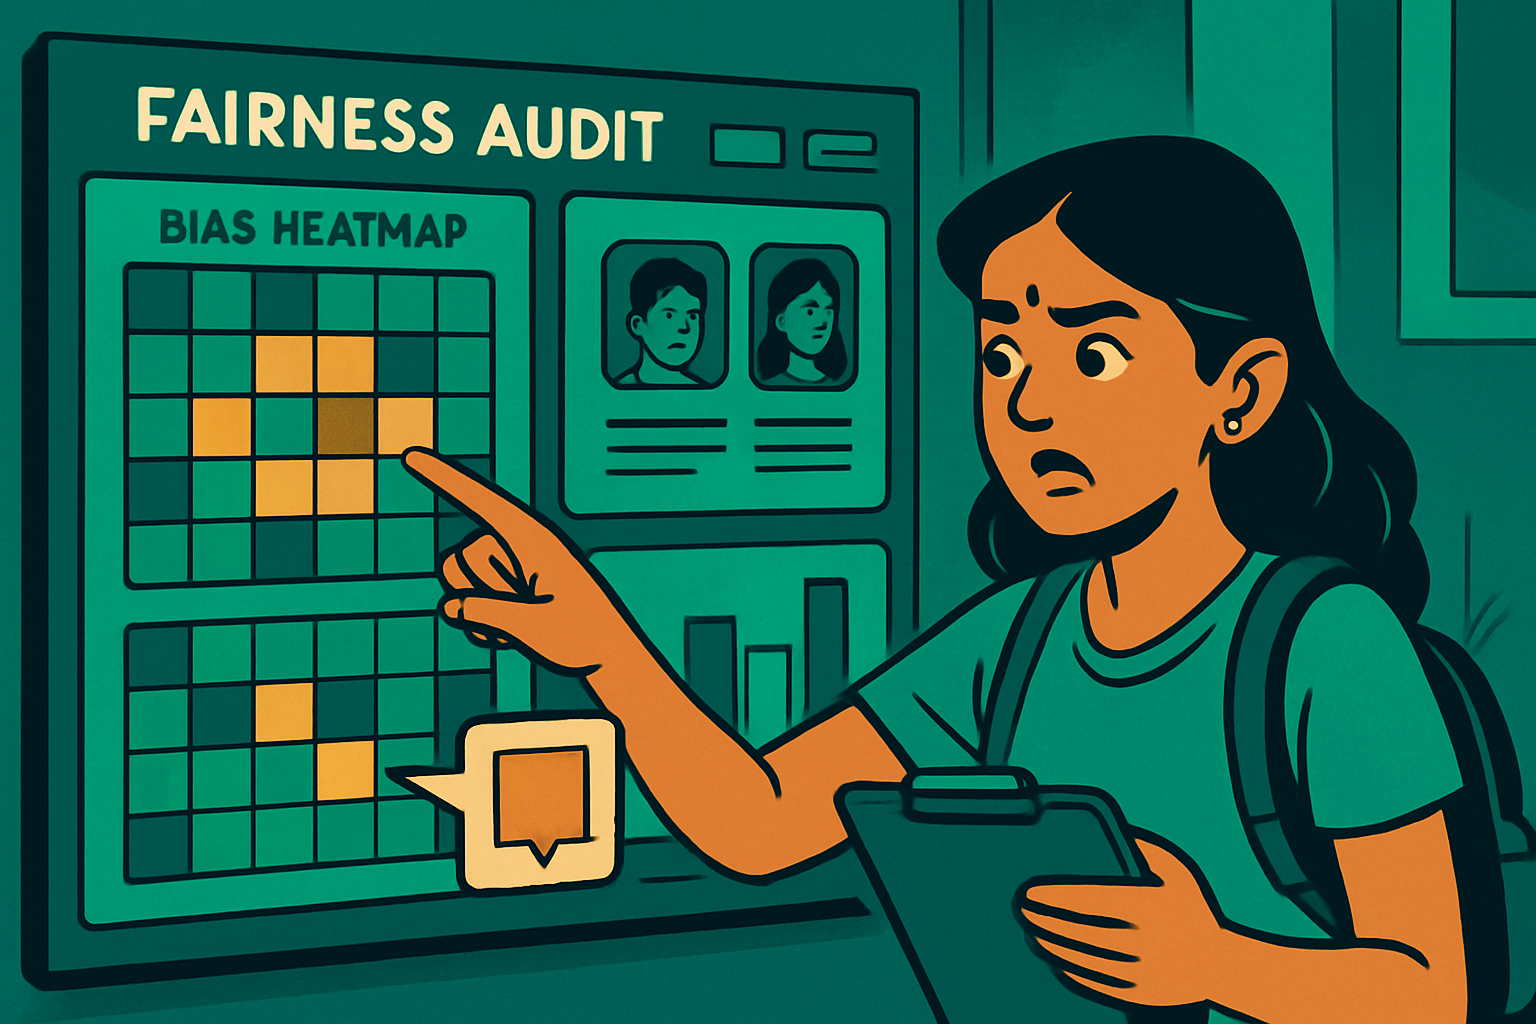
Amar ran a fairness audit. He was disturbed by what he found: his model was 79% accurate for urban applicants but only 61% accurate for rural applicants. It had a false positive rate (incorrectly flagging good loans as risky) of 8% for urban areas but 31% for rural areas. "My model would have denied loans to 3× more legitimate rural borrowers," he said. "That's not a technical bug. That's an injustice."
A human loan officer making a biased decision affects one person. An AI model deployed at scale makes biased decisions millions of times per day — and because it feels "objective" and algorithmic, the bias is harder to detect and challenge.
In India, historical bias in data is especially acute:
- Lending data: Banks historically lent less to women, rural areas, and lower castes — so a model trained on historical approvals "learns" to replicate those patterns
- Healthcare data: Diagnostic datasets often underrepresent dark skin tones, women in cardiac studies, rural populations
- Employment data: CVs historically from top colleges → model penalises regional universities regardless of actual candidate quality
| Metric | Definition | Formula | Amar's model result |
|---|---|---|---|
| Demographic Parity | Each group gets approved at equal rates | P(approve|urban) ≈ P(approve|rural) | Urban: 72% approve, Rural: 41% approve |
| Equalised Odds (stronger) | Each group has equal TPR AND equal FPR | TPR_urban ≈ TPR_rural AND FPR_urban ≈ FPR_rural | FPR: 8% urban vs 31% rural ❌ FAILS |
| Calibration | Predicted probability matches actual rate | P(default|score=0.7) ≈ 70% for all groups | Well-calibrated overall |
# Responsible AI Audit with Fairlearn — Google Colab
!pip install fairlearn scikit-learn pandas matplotlib -q

import numpy as np
import pandas as pd
from sklearn.datasets import make_classification
from sklearn.model_selection import train_test_split
from sklearn.ensemble import GradientBoostingClassifier
from sklearn.pipeline import Pipeline
from sklearn.preprocessing import StandardScaler
from sklearn.impute import SimpleImputer
from sklearn.metrics import accuracy_score, confusion_matrix
from fairlearn.metrics import (
    MetricFrame, demographic_parity_difference,
    equalized_odds_difference, false_positive_rate
)
from fairlearn.postprocessing import ThresholdOptimizer
import matplotlib.pyplot as plt

# ── Step 1: Generate biased dataset ──
np.random.seed(42)
n = 2000

# Rural group (40% of sample, worse features due to historical underbanking)
urban_mask = np.random.choice([0, 1], size=n, p=[0.4, 0.6])
X = np.column_stack([
    np.random.normal(50, 15, n) + urban_mask * 10,  # income higher in urban
    np.random.normal(200, 80, n) - urban_mask * 20, # loan amount
    np.random.normal(650, 80, n) + urban_mask * 40, # credit score biased up for urban
    np.random.normal(5, 3, n).clip(0),              # employment years
    np.random.randint(0, 4, n).astype(float)        # existing loans
])
# Ground truth default: mainly income and loan ratio, NOT location
true_default = ((X[:, 0] / X[:, 1]) < 0.3).astype(int)

df = pd.DataFrame(X, columns=['income', 'loan_amount', 'credit_score',
                                'employment_years', 'existing_loans'])
df['is_urban'] = urban_mask
df['default']  = true_default

X_train, X_test, y_train, y_test, grp_train, grp_test = train_test_split(
    df.drop(['is_urban', 'default'], axis=1),
    df['default'], df['is_urban'],
    test_size=0.3, random_state=42
)

# ── Step 2: Train baseline model ──
pipeline = Pipeline([
    ('imputer', SimpleImputer(strategy='median')),
    ('scaler',  StandardScaler()),
    ('model',   GradientBoostingClassifier(n_estimators=100, random_state=42))
])
pipeline.fit(X_train, y_train)
y_pred = pipeline.predict(X_test)

print("=== BASELINE MODEL AUDIT ===")
print(f"Overall accuracy: {accuracy_score(y_test, y_pred):.3f}")

# ── Step 3: Fairness metrics with MetricFrame ──
mf = MetricFrame(
    metrics={
        "accuracy":           accuracy_score,
        "false_positive_rate": false_positive_rate
    },
    y_true=y_test,
    y_pred=y_pred,
    sensitive_features=grp_test.map({0: "Rural", 1: "Urban"})
)

print("\nAccuracy by group:")
print(mf.by_group["accuracy"].to_string())
print("\nFalse Positive Rate by group (incorrectly flagged as default):")
print(mf.by_group["false_positive_rate"].to_string())
print(f"\nDemographic Parity Difference:  {demographic_parity_difference(y_test, y_pred, sensitive_features=grp_test):.3f}")
print(f"Equalised Odds Difference:       {equalized_odds_difference(y_test, y_pred, sensitive_features=grp_test):.3f}")
# 0 = perfectly fair | 1 = maximally unfair

# ── Step 4: Mitigate bias with ThresholdOptimizer ──
# Adjust decision thresholds per group to equalise FPR
mitigator = ThresholdOptimizer(
    estimator=pipeline,
    constraints="equalized_odds",
    objective="accuracy_score",
    predict_method="auto"
)
mitigator.fit(X_train, y_train, sensitive_features=grp_train)
y_pred_fair = mitigator.predict(X_test, sensitive_features=grp_test)

print("\n=== AFTER FAIRNESS MITIGATION ===")
mf_fair = MetricFrame(
    metrics={"accuracy": accuracy_score, "false_positive_rate": false_positive_rate},
    y_true=y_test, y_pred=y_pred_fair,
    sensitive_features=grp_test.map({0: "Rural", 1: "Urban"})
)
print(f"Overall accuracy: {accuracy_score(y_test, y_pred_fair):.3f} (may decrease slightly)")
print("\nAccuracy by group:")
print(mf_fair.by_group["accuracy"].to_string())
print("\nFalse Positive Rate by group (after mitigation):")
print(mf_fair.by_group["false_positive_rate"].to_string())
print(f"\nEqualised Odds Difference after mitigation: {equalized_odds_difference(y_test, y_pred_fair, sensitive_features=grp_test):.3f}")A Model Card (developed by Google) is a short document every deployed AI model should have. It records:
- What the model does and intended use cases
- Training data description (what populations are represented)
- Performance metrics broken down by demographic group
- Known limitations and failure modes
- Ethical considerations and recommended uses
India's Digital Personal Data Protection Act (DPDPA) 2023 creates legal obligations for AI systems processing personal data:
- Explicit consent required before processing personal data for AI decisions
- Right to explanation: people can ask why an automated system denied them credit/service
- Data Fiduciary (company using AI) is responsible for accuracy and fairness
- Children's data (under 18) requires verifiable parental consent
- Demographic representation: Does training data include all groups who will use the system? Especially rural, women, lower-income, and language minorities?
- Fairness metrics: Calculate accuracy, FPR, and FNR separately for each demographic group. Document results.
- Failure mode analysis: What happens when the model is wrong? Is the harm proportional and reversible?
- Human override: Is there a clear process for affected people to appeal an AI decision to a human?
- Model card: Write and publish a model card before deployment. Link to it from your app's About page.
- Consent: Do users know their data is being used for AI predictions? Is this disclosed clearly?
- Monitoring plan: How will you detect if model performance or fairness degrades after deployment?